Orlando City
How Should We Make Sense of Orlando City’s Defense in 2024?
An evaluation of Orlando City’s defensive players thus far this season.

Everyone loves offense, no matter the sport. Whether it be baskets, goals, runs, touchdowns, tries, or any other manner of scoring, much more focus is often put on the scoring of points than the defensive side of preventing them. Since I started writing for The Mane Land, I have only written about offense, so just like when at a concert the band likes to give the drummers some love by focusing on them, it is time to shift to looking at Orlando City’s defense thus far this season.
Alas, at a high level, the initial dive into Orlando City’s 2024 defense does not look that great. Opponents have scored 36 goals already this season in only 22 games, as compared to 38 for the entire 2023 regular season (34 games). The chart below, created using data from Opta and fbref.com, compares Orlando City to the rest of MLS in some key defensive areas and the results are, shall we say, less than ideal. One definition before you look, “MLS avg” is the average of every other team except Orlando City.

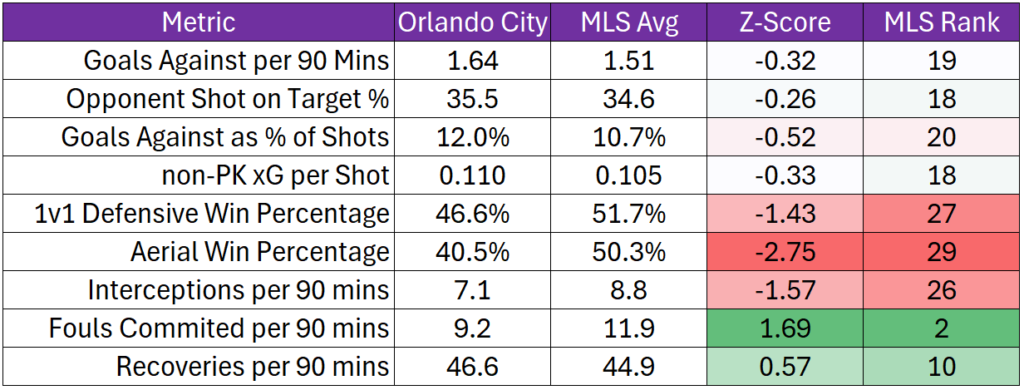
A few notes on this data:
- I know you all remember from this math class, but Z-Scores measure how many standard deviations away from the average a value is. For example: if an average is 100 and the standard deviation is 5 then a value of 110 is 2 standard deviations more than the average, which would be a Z-score of 2. In general Z-Scores greater than 2 or less than -2 are pretty rare, and indicate that a value is an outlier as compared to the average.
- Orlando City is not good at winning balls in the air. But there is some good news. Orlando City’s defenders (47.1% win rate) are at least better than the team’s attacking players (38.4%), but the MLS average win rate for defenders is 57%, and Orlando City’s defenders also rank 29th when compared to every other squad’s defenders. As a reminder there are only 29 MLS teams, so you cannot rank below 29th. Not great, Bob.
- In general, I do not love xG (expected goals) as a stat. The reason why is that it simply measures the overall percentage of goals per shot from a location on the field, but it does not take into account who is shooting (my 7-year-old son, Brayden’s, xG is the same as Facundo Torres’ from any spot on the field. Until recently, this may have actually been legitimately true for both when they used their right foot.). That said, I do think it is helpful to look at xG as a relative measure of where shots are coming from, or in this case, where Orlando City is allowing shots to be taken from. Orlando City is giving up shots more frequently than other MLS teams from places that, historically, have generated more goals.
I want to go a little more in depth on the two items that show as green on that chart, Fouls committed per 90 minutes and recoveries per 90 minutes. Orlando City is doing well — very well — compared to the rest of MLS in both, but what does that really mean?
Committing fewer fouls than other teams seems like a good thing, but this is where numbers simply do not provide enough context to determine whether it is actually good or not to be a “clean” team and not foul. A few more tactical fouls in the buildup of play and maybe a few of the goals scored against Orlando City do not happen. A few more fouls on attacking players trying to beat an Orlando City player 1-v-1 early in the game, and perhaps they look to pass instead of taking on defenders late in the game. Orlando City has been elite this year at not fouling, but I do not think there is enough data here to conclude whether that is actually helpful.
Similarly, being in the top third of the league in recoveries (of loose balls) per 90 minutes may be another stat that sounds better than it is. Yes, it does show that the team is hustling and getting possession of the ball, and in general in soccer, if you have the ball, the other team cannot score. I do not want to take anything away from the hustle of this team, because it certainly does have a lot of players who give maximum effort, and winning two more loose balls per game than the average team could be the difference in winning and losing a game.
But it could also just mean that your own team is a little careless with the ball and you are one step quicker to get to the ball when it gets loose. I think for this particular stat it is more about hustle than good defense, so a positive but not necessarily an indication of defensive prowess.
So, we have some stats that show that as a team Orlando City has been in the mid to lower part of the league, but why? What is really driving this change from a team that was tied for seventh for fewest goals conceded during the 2023 season?
While goals against come against the entire team, in general, the primary group responsible for goals are those who play in the back. I’ve gone through every match and evaluated who was playing and when, and the chart below I think starts to really tell the tale of why the defense has not prevented as many goals as in previous seasons. (Note: Opponent SoT% is the percentage of shots the opponent put on target.)

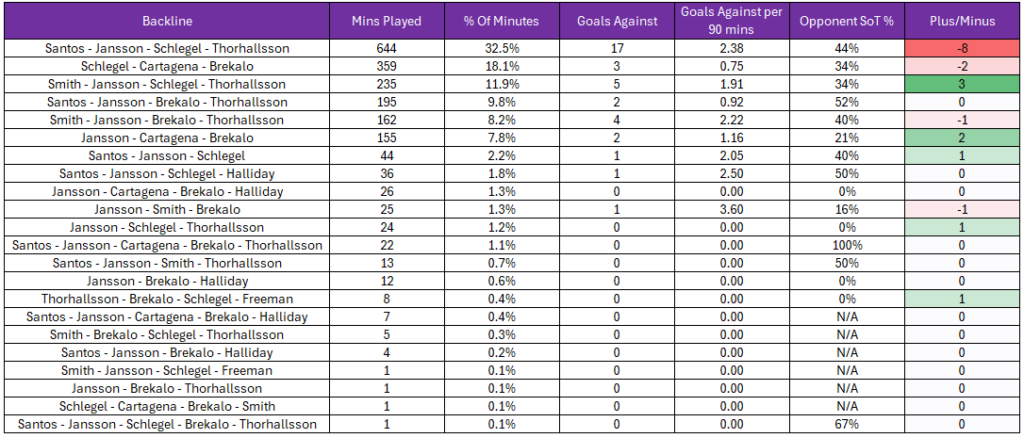
I know this chart may have been a lot to look at, but that is also part of the point. The Lions have not had a lot of consistency in their back line this season, with 22 different groupings in the back playing at least one minute and six different groups playing at least 150 minutes. Breaking the list down, we can also see that:
- The defensive group that has played the most minutes has not even played one-third of the total minutes this season, so there has just not been a lot of game time for any one unit to play together and gel as a group.
- The defensive group that played approximately one-fifth of the minutes so far this season includes a midfielder, Wilder Cartagena, and was used as part of a back three playing with two wingbacks, not Orlando City’s preferred formation but one the club had to use a lot because of the next item on this list.
- Robin Jansson has already missed more minutes in 2024 (400) than he did in all of 2023 (180). The man is the captain for a reason, and he certainly would have played most if not all 400 of those minutes had he been available.
- Smoking Gun Alert: Jansson and David Brekalo have only played 610 minutes together all season (30.8% of all minutes), but in those minutes, their goals against per 90 minutes is only 1.33, which is 25% better (let me repeat, 25% better!) than Orlando City defensive lineups without those two playing at the same time (1.77 Goals Against per 90).
Not every lineup that Orlando City has rolled out with Jansson and Brekalo in the middle has been successful, and they still have only played a pretty low number of minutes together, but at more than 600 minutes played together there is now a good sample size to say that the data backs up that Orlando City’s best defensive lineup should include Jansson and Brekalo.
Another reason it is critical to have two stalwart center backs like Jansson and Brekalo on the field is that Óscar Pareja’s offensive game plan generally includes his outside backs making runs up the field to put pressure on the defense. The three primary outside backs who have played most of the minutes this year — Rafael Santos, Kyle Smith, and Dagur Dan Thórhallsson — all average between 2.0 and 2.2 shot-creating actions per 90 minutes, and next-in-line Mikey Halliday nearly did (1.7) last year as well, though he has been hurt for most of this season, so he has not played very much.
If you are going to have your outside backs bombing forward, which Dagur Dan in particular has aggressively been doing recently (2.9 shot-creating actions per 90 mins during his last five games), then you need to have stability staying home in the back, and both the data and the eye test tilt toward that stability being recommended to come from Jansson and Brekalo.
The outside back pairings do not show significant pluses or minuses based on which two are playing, so I expect that in the upcoming weeks Pareja will roll with who he thinks has the hot foot offensively, which in the last two matches has been Smith and Thórhallsson. Last year’s success primarily came with Santos and Thórhallsson on the outside though, so I expect that as Orlando City pushes for a playoff spot during the final few months of the season, they will still be tinkering a little bit. Constant change in the back has contributed to where Orlando City is in the defensive rankings and in the table, but at some point assuredly the back line will stop a-changin’. My dad will love that reference.
With the transfer window opening up I find it unlikely that Orlando City will look to add on the defensive side; the Lions have gotten through some injuries and the Euros, so barring injury (cross your fingers and knock on wood, thank you), they should hopefully have one consistent group to choose from for every game going forward.
The team took off last season once it really locked into a consistent 11 during the second half of the season, and there is no good defense for why that could not happen again this year.