Orlando City
Orlando City’s Usage Rate and Shot Creation Through Seven Games
An analysis of Orlando City’s usage and shot-creation rates and a comparison of their top performers to the rest of MLS.

As so often happens in articles about soccer, I am going to open by writing about…not soccer. The NBA regular season is in its final days, and so a lot of the discourse on podcasts or TV shows about basketball is about who deserves what awards for the 2024-2025 season. This is not the place for that discussion, though I do think my son’s favorite Orlando Magic player, Paolo Banchero, has had a great season. What I want to explore as it relates to basketball awards is how the concept of “usage” plays a big role when comparing players against one another.
Usage in basketball is essentially a measure of what percent of a team’s possessions were finished by a given player, whether it was via a shot, turnover, or offensive foul. There are different formulas for usage, as some get even more intricate as it relates to the definition of a possession, but we are going to change the subject to soccer momentarily so let’s not dwell on the basketball metric any longer than necessary. The critical part of usage is that it is easier to put up scoring numbers — the numbers fans often default to when evaluating who are the best players, when you have a much higher usage rate. If most possessions end with the ball in your hands, then the offense is likely designed around you, and the opportunities will be there for more baskets.
In soccer, usage can be looked at similarly, with goals instead of baskets, and I will draw on the work of several other authors in how they have calculated usage, or, as they often refer to it, possession-ending actions. In soccer it is similar to basketball, but we will get more nuanced with the definition. Here are the possession-ending actions I used, with all data coming from Opta’s tracking on fbref.com:
- Shots
- Incomplete passes
- Failed Ttake-ons
- Dispossessions
- Miscontrols
I looked at this data in two ways: first by normalizing the data by taking the total number of possession-ending actions and calculating it on a per-90-minutes-played basis (PEA / 90) , and then also by taking a player’s possession-ending actions and dividing them by the total number of possession-ending actions for the whole team, to see their percentage (usage rate). Here is a look at Orlando City’s performance thus far this season (I’m only including field players who have played at least 300 minutes, but a quick shout out to Gustavo Caraballo for generating a PEA per 90 minutes of 40 in his nine minutes played thus far this season. Gustavo was really goosing the throttle when he had the ball. I’ll see myself out.):
| Player | Mins Played | PEA / 90 | Usage Rate |
|---|---|---|---|
| Rodrigo Schlegel | 630 | 7.3 | 5.5% |
| Alex Freeman | 575 | 15.2 | 10.5% |
| Martín Ojeda | 571 | 15.4 | 10.5% |
| Marco Pašalić | 550 | 15.4 | 10.2% |
| Iván Angulo | 523 | 12.9 | 8.1% |
| Eduard Atuesta | 514 | 16.1 | 9.9% |
| Luis Muriel | 490 | 16.3 | 9.5% |
| César Araujo | 450 | 5.6 | 3.0% |
| Robin Jansson | 450 | 6.6 | 3.6% |
| Rafael Santos | 420 | 18.5 | 9.4% |
It is nice when data backs up the eye test, and the eye test thus far this season definitely shows that Cesar Araujo, Robin Jansson, and Rodrigo Schlegel play conservative soccer, which is critical being that they generally possess the ball in the center of the field near their own goal, whereas the attacking players and the fullbacks are much more likely to be trying to create something on offense, and therefore ending a possession.
I was a little surprised to see Rafael Santos as the player who is ending the most possessions on a per-90-minute basis, but he is someone who is constantly looking to switch the field or play in a cross, and those are low-probability passes that have a low completion rate, meaning they often end a possession.
Usage rate depends heavily on minutes played, as despite the name, it has elements of a counting statistic in it, and it was not surprising to see the top three players in usage rate being non-central defenders who had played a lot of minutes. Santos is again high here because of his style of play, but as it appears that he may be fighting for his starting position, that number will likely drop over the next few games, unless he wins back the left back role.
As a quick aside, only one Orlando City player had a usage rate in double digits during MLS regular-season play in 2024, and as you may have guessed, that player was indeed Facundo Torres, with exactly 10%.
Usage rate is really a statistic that helps identify players who are trying to make something happen (shots, incomplete passes, failed take-ons, dispossessions) or who are targets for teammates trying to make something happen (miscontrols of a ball passed to them), but ultimately what is the most impactful when trying to make something happen is whether a shot gets created, because shots turn into goals, and that is how games are won. If we look at the same group of Lions and focus specifically on creating shots (shot-creating actions + shots taken), the story looks a little different in terms of where those come from:
| Player | Mins Played | Shots Created / 90 | Shots Created % |
|---|---|---|---|
| Rodrigo Schlegel | 630 | 1.0 | 2.4% |
| Alex Freeman | 575 | 4.2 | 9.4% |
| Martín Ojeda | 571 | 8.6 | 18.9% |
| Marco Pašalić | 550 | 5.7 | 12.2% |
| Iván Angulo | 523 | 3.1 | 6.3% |
| Eduard Atuesta | 514 | 6.0 | 11.9% |
| Luis Muriel | 490 | 7.0 | 13.3% |
| César Araujo | 450 | 2.8 | 4.9% |
| Robin Jansson | 450 | 0.2 | 0.3% |
| Rafael Santos | 420 | 3.8 | 6.3% |
Alex Freeman, Martin Ojeda and Marco Pašalić lead the way in usage rate, but they are closely grouped together, and Eduard Atuesta, Luis Muriel, and Santos were not too far behind. Ojeda is in a class by himself when it comes to creating shots though — significantly ahead of Muriel and Pašalić. Freeman is well ahead of his defensive teammates too, and if you look at the scatterplot below of all MLS defenders from 2024 and 2025, you can see that there are very few defenders who are as attack minded and who help create as high a percentage of their team’s shots as he does (Freeman’s 2025 season is in the purple bullseye, 2024 defenders played at least 500 minutes and 2025 defenders played at least 300 minutes):

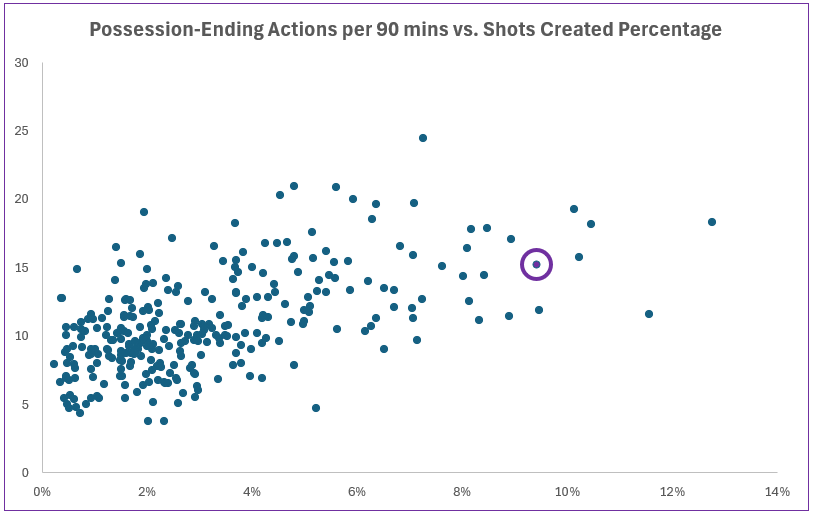
I know someone who was driving the Freeman bandwagon last year, and that person, who may or may not have written the words you are are reading right now, is pretty fired up about how much he is contributing for the Lions this season.
I mentioned earlier that Ojeda is well ahead of his teammates in 2025 in shot-creation percentage, but there are some other MLS players who are far more of a focal point of their team’s offense than he is. The below chart is formatted similarly (the y-axis is on the same scale but the x-axis is not, as attacking players generally create a much higher percentage of shots), and is for midfielders and strikers for for the 2024 and 2025 MLS seasons (Ojeda’s 2025 season is in the purple bullseye, and the same minimum minutes played requirements are in place):

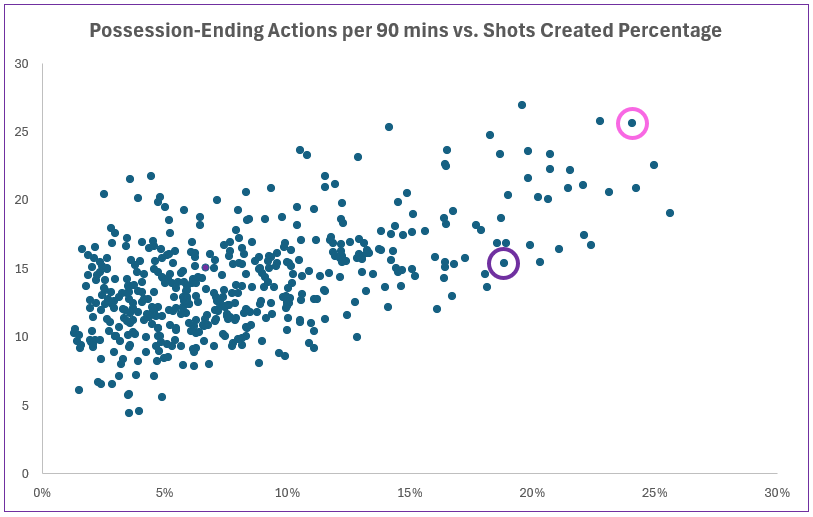
As you might have guessed from the pink bullseye, that is indeed Lionel Messi, with his 25.6 possession-ending actions per 90 minutes and 24% of his team’s shots created thus far this season. Messi’s metrics existing above and to the right of Ojeda’s on this chart is not an indication that he is better than Ojeda (although to be fair, he might be), but what it shows is that he initiates more attacking plays and is involved in more of Miami’s shots than Ojeda is in Orlando City’s.
The age-old quantity vs. quality conversation exists as it relates to looking at usage rate and the percentage of shots created by a player. Whether it be basketball or soccer, teams are not looking for players who create or take shots. They want players who will create and make shots. Taking on defenders every time you receive the ball or constantly trying to hit risky passes will increase the various counting and rate stats, but unless a player is successful with those take-ons and passes, what they will more likely get is a seat on the bench and a pause on accumulating any new stats.
I will be tracking the usage numbers throughout the season, and we will revisit them later in the year to see what has changed. With the return of Duncan McGuire to fitness, it will be interesting to see what that does to Ojeda’s usage if he starts to play more minutes out on the wing — and also to that of Muriel if he more frequently plays as the number 10 instead of playing as a striker. The insertion of David Brekalo into the starting lineup may unleash Freeman even more and evoke more comparisons to his wide receiver father as he flies up the sideline looking to receive a long bomb and turn it into a score.
In the end, the stats from this article are not ones that players will be trying to improve. They are more descriptive statistics that explain how the team — and particularly the offense — has interacted thus far this season. Usage rate may be important, but what is more important is that Orlando City gives the opposing net some serious usage in the match this weekend.
Vamos Orlando!