Orlando City
Beyond the Stat Sheet: Maxime Crépeau’s Strong Start In Orlando
Maxime Crépeau’s season thus far and how he compares to the other MLS goalkeepers.

Despite the best attempts by math teachers across the world, including me in the first decade of this century, math is the subject that is most often cited as the one that people disliked the most when they were in school. While I do not enjoy this, I understand it, because math is difficult and only brilliant and sophisticated people like me could ever grasp such complex topics as addition and division.
I may have ever so slightly exaggerated my intelligence level in the previous sentence.
Math is difficult, however, especially because it often requires context in order to be fully understood, and in many cases, the context is as clear as pondwater. This is magnified when it comes to statistics, and why statisticians prefer to talk about confidence levels and ranges instead of providing a specific answer. Sports are chock full of statistics, but without painstaking work to evaluate the context of how those numbers happened, it is hard to truly feel like any particular statistic is a true differentiator among players or teams.
For example, Orlando City has allowed the most goals this season, “leading” the league in both the actual number of goals allowed and also in goals allowed per 90 minutes. There is no dispute about this, but there is also no context with those numbers as to why. The eye test says that the defense has not always looked cohesive on the field, and several starters have missed time due to injuries. The starting lineup in the last two games included Zakaria Taifi as the left back, and he does not have a lot of experience playing this position at the MLS level, or any level, yet
According to playoffstatus.com the Lions have also played the seventh-hardest schedule in the league, which certainly has not helped with keeping the ball out of the back of the net. At all. Because, as math clearly states, 2.45 goals allowed per 90 minutes = yikes.
On our site and on our PawedCasts we have focused a lot on the back line and its struggles, but it is Maxime Crépeau who is usually the one actually taking the ball out of the net. As with every goal allowed, there is a share of the blame pie that goes to each player, but in general, the heaviest responsibility is borne by the defenders and goalkeeper, so let’s take a look at the Canadian netminder’s performance thus far this season.
The analysts at American Soccer Analysis (ASA) have a goals added model specific to goalkeepers, built on top of six different metrics. At this point in the season, 37 goalkeepers have played at least 500 minutes, and Crépeau’s rank in each category and the overall rankings is shown in the table below.
| Metric | Rank in MLS – 2026 |
|---|---|
| Claiming | 10 |
| Fielding | 7 |
| Handling | 36 |
| Passing | 34 |
| Shotstopping | 25 |
| Sweeping | 10 |
| Overall Goals Added (g+) | 25 |
The models are proprietary, and I am confident that they were designed to try to take as much into account as possible, but as much as it pains me to say as a math person, I think goalkeeping data is very noisy and is much more directional than precise. There are so many dependencies with every cross and shot that is played into the box, and models can try to account for them all but they are never able to do so.
As a case in point, FotMob also its own proprietary goalkeeper metrics, with its leading metric being goals prevented. What this boils down to is the number of actual goals allowed as compared to the amount of expected goals (xG) allowed, which is in and of itself a measure that sounds precise but has its own inherent flaws. Every shot from a particular grid on the field is assigned the same expected goal percentage, no matter the shooter, whether they were using their preferred foot, if they were shooting it with a clean look at goal or under duress, if the shot was true or was deflected, and a host of other aspects that could come into play on a shot.
Over thousands of shots the percentages are likely very close to the xG, but most goalkeepers have faced between 80-120 shots on target this season (Crépeau ranks second, at 135), and with that small of a sample there will be some major variation in the xG calculations. Crépeau ranks 25th in g+ from ASA but 12th in goals prevented on FotMob, so clearly there is something significantly different in its models as it relates to the shots he has faced. Matt Turner, however, is top on both metrics, but take a look at the shot charts from Turner and Crépeau from FotMob below (there is one goal on each side circled in red; sadly I could not remove that from the screenshot), and some of why that is can be explained visually.

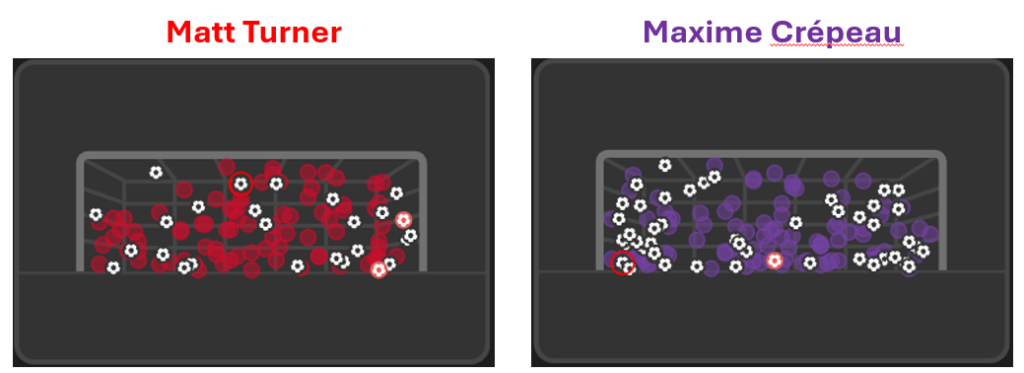
Aside from Clark Kent, very few people on Earth can fly (is Clark Kent really a person, though? A question for another site). Turner has not seen any shots on target in the upper right-hand corner of his net thus far this season, whereas Orlando City’s opponents have put a bunch of shots there, in an extremely difficult location for Crépeau to save them. Neither goalkeeper has any control over that, and with such small samples of shots on target, the prevalence of shots to extremely difficult locations against Crépeau compared to Turner plays a large role in the differences in their rankings.
To be fair to Turner, he is an excellent goalkeeper. These illustrations are more about the effects on Crépeau’s rankings than to take away from Turner’s.
Another measure of goalkeeper statistics is save percentages by shots taken from inside and outside the box, which is tracked by Sofascore. This is a truly objective measure — no models or formulas, just the percentage of saves by the location of the shot. The chart below shows the differences in save percentages by each goalkeeper against the league average during the past two seasons (a value in the green quadrant would show a goalkeeper that saved a higher percentage of shots inside the box (x-axis) and outside the box (y-axis) than the league averages of 61% for inside the box and 83% for outside the box).

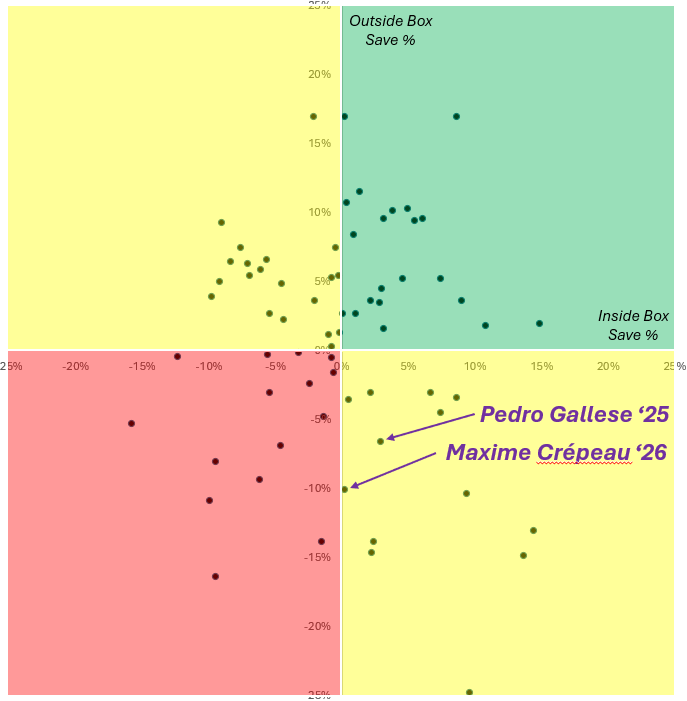
Both of Orlando City’s starters during the last two seasons were subpar against shots from long range (Crépeau is 10% below average, Gallese was 7% below), but El Pulpo was slightly better than average on shots from inside the box and Crépeau was nearly exactly dead on with the two-season average.
Hang on, though, because just when you thought this was objective, it kind of also is not. Outside the box means anywhere outside of the lines, and Orlando City has allowed nine shots from just on the other side of the line, including six from right in the semicircle at the top of the box. That is an incredibly dangerous location, but it counts as outside the box just the same as a 30-yard long-range attempt, a.k.a., the Luis Muriel Not-so-special.
Crépeau has allowed 10 goals on 38 shots from outside the box, but half of those goals are from 18-20 yards away and in the middle of the field, which is a more dangerous location than many locations inside the box.
Additionally, of those 10 outside -the-box goals only one has happened since the World Cup break. The Canadian was excellent during the World Cup and has been as well for the Lions since the season resumed. Perhaps playing for his country sparked this recent run of strong play, or perhaps he just needed time to settle in with his new team. Either way, Crépeau and Orlando City are only allowing 1.43 goals per game since the season resumed, a massive improvement compared to the 2.93 from the opening months.
It would have been nice if the team had only given up two instead of three at Minnesota, but then again, if not for some incredible plays by Crépeau in the first half, the Lions might have given up four or five, so only allowing three was actually somewhat positive.
And that is always the conundrum for goalkeepers. Giving up three goals was bad! Wait, but it probably should have been worse, so giving up three was good! The analytical models do not take into account that Robin Jansson passed a ball straight to Minnesota to give the Loons a quick counterattack against minimal defenders, or that Taifi was too far inside and double teaming a Loon instead of playing out on the left side where he should have been, allowing a wide-open attack in his area.
The statistics say three goals allowed against Minnesota, with precise physical locations of the shots and associated xG values, but as the ever-brilliant Mark Twain once said, “there are three kinds of lies: lies, damned lies, and statistics.”
The numbers tell some of the story of Crépeau’s performance against Minnesota and of his season so far, but having watched every minute of every game this season, I think the truth of the matter is that he has outperformed expectations and has been an excellent replacement after the departure of club legend Gallese.
And he has done it with only two arms, a statistically significant difference in arms than the eight of El Pulpo. That might be the only goalkeeping statistic that everyone agrees about from this article.
Vamos Orlando!